
By 2018, the United States had not seen a decrease in oil and natural gas production in over a decade. The shear volume of all the additional resources discovered has cause issues upstream. Transporting, disposing, and processing at this magnitude has become a cause for concern, particularly for those active in the Permian Basin in West Texas and New Mexico. However, there is no need for alarm yet… a resolve will come shortly.
Over the last two years, the big bottleneck talk related to the Permian has centered on the need for a major expansion of pipeline takeaway capacity to move oil, natural gas and natural gas liquids (NGLs) out of the basin to major market and refining centers along the Texas and Louisiana Gulf Coast. But that particular bottleneck is about to start resolving itself during course of this year. Midstream projects will add up to 6 million barrels of oil equivalent of new takeaway capacity out of the Permian by the end of 2021, and that just from the projects currently Underway.
– (Source): Forbes Article David Blackmon
The SCOOP on Oklahoma’s O&G Production
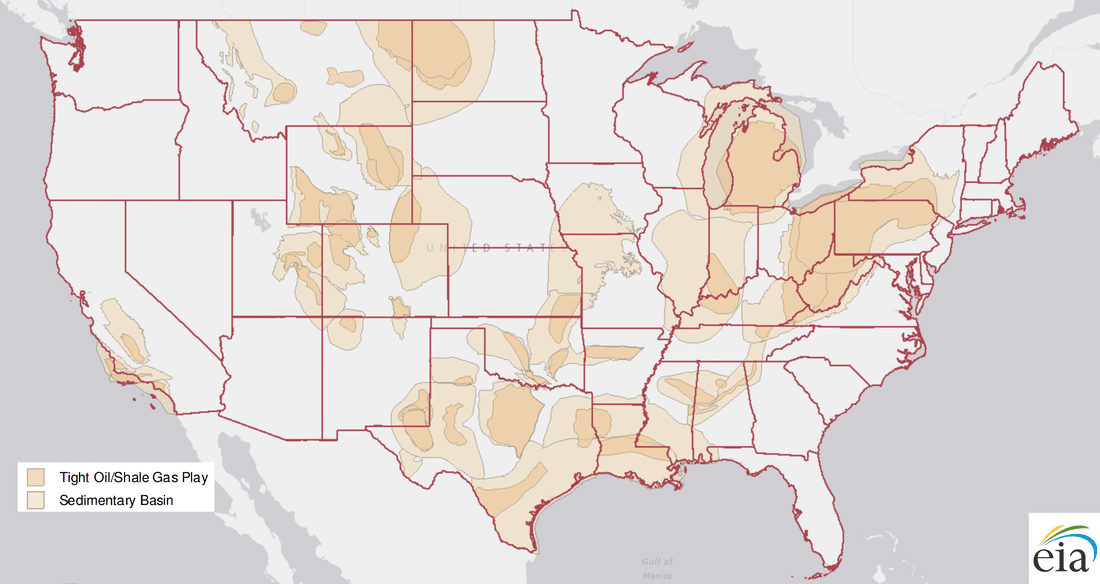
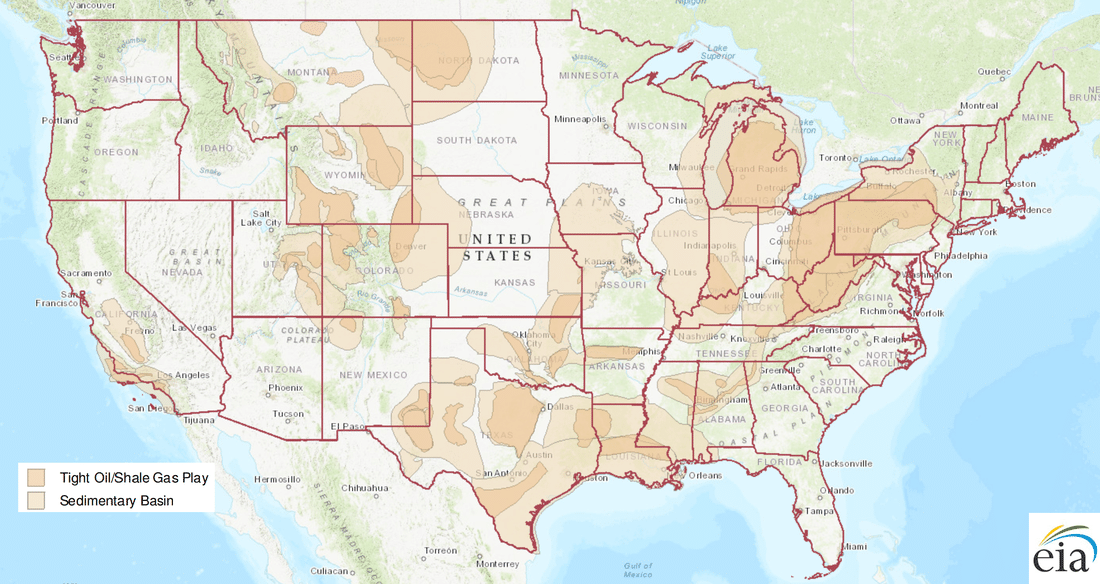
Oklahoma STACKS up fairly well when compared to the entire United States. Nestled right in the middle of oil & gas country there are not any shortages of fossil fuel production in Oklahoma. Starting from the first well completed in the late 1800s up until today oil & gas has been an integral part of the state. Most of Oklahoma production today comes from 3 major regions: Anadarko Basin, Nemaha Uplift, Arkoma Basin. Within the 3 major geological marks we have a number of large resource plays like the Granite Wash to the west, Cana-Woodford, Missippian Lime, STACK (Sooner Trend, Anadarko Basin, Cannadian , & Kingfisher counties), SCOOP (Central Oklahoma), and Arkoma-Woodford to the east.
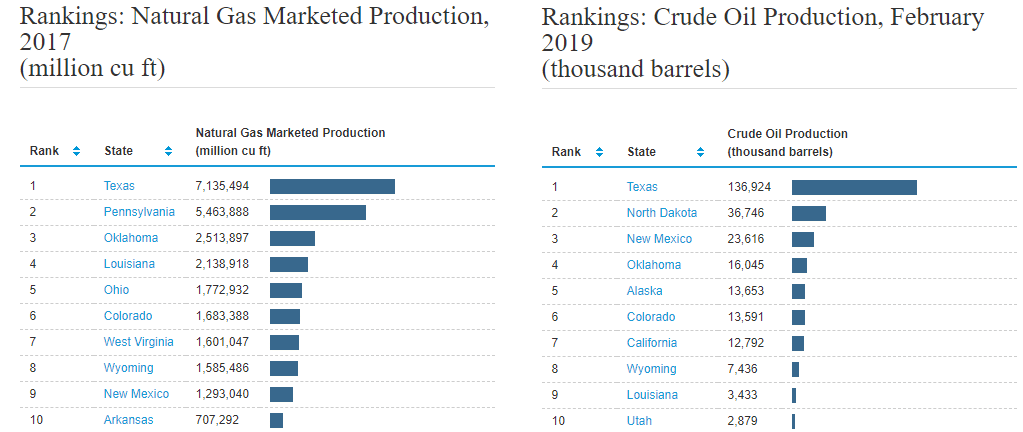
Over the last decade Oklahoma has tripled their crude oil production and nearly doubled natural gas volumes, as of March 2019, crude oil was at 590,000 BOPD and 8,534,000 mcf. This increased production mirrors the overall trend of United States production, implying the Oklahoma E&P industry is healthy. Texas sweeps the board for both oil and natural gas production. Oklahoma currently stands at 4th place for crude oil and 3rd for natural gas when compared to other states (eia.gov).

Top 10 Oklahoma Oil & Gas Operators
As our investigation continued we drilled deeper and looked at the top oil and gas producers in Oklahoma. Newfield, Devon, & Continental currently produce the greatest amount of oil and natural gas, however when we look at production by property a slightly different picture is painted. In some cases we see smaller operators producing fewer properties yet at a higher average rate per property.
View specific rates & maps below…
| # | Operator | BOPD | Lease Count | Avg BOPD per Lease |
|---|---|---|---|---|
| 1 | NEWFIELD EXPLORATION MID-CONTINENT INC | 79,384 | 828 | 96 |
| 2 | DEVON ENERGY PRODUCTION CO LP | 51,623 | 777 | 66 |
| 3 | CONTINENTAL RESOURCES INC | 38,648 | 706 | 55 |
| 4 | MARATHON OIL COMPANY | 27,147 | 340 | 80 |
| 5 | OKLAHOMA ENERGY ACQUISITIONS LP | 25,694 | 388 | 66 |
| 6 | EOG RESOURCES INC | 16,089 | 138 | 117 |
| 7 | CHESAPEAKE OPERATING INC | 14,681 | 1923 | 8 |
| 8 | CHAPARRAL ENERGY LLC | 13,725 | 422 | 33 |
| 9 | CITATION OIL & GAS CORPORATION | 12,371 | 324 | 38 |
| 10 | ROAN RESOURCES LLC | 12,326 | 441 | 28 |
| # | Operator | BOPD | Lease Count | Avg BOPD per Lease |
|---|---|---|---|---|
| 1 | REVOLUTION RESOURCES LLC | 3,988 | 26 | 153 |
| 2 | PALOMA OPERATING CO INC | 4,037 | 28 | 144 |
| 3 | EOG RESOURCES INC | 16,089 | 138 | 117 |
| 4 | TRAVIS PEAK RESOURCES LLC | 3,047 | 27 | 113 |
| 5 | NEWFIELD EXPLORATION MID-CONTINENT INC | 79,384 | 828 | 96 |
| 6 | TRIUMPH ENERGY PARTNERS LLC | 5,162 | 58 | 89 |
| 7 | MARATHON OIL COMPANY | 27,147 | 340 | 80 |
| 8 | DEVON ENERGY PRODUCTION CO LP | 51,623 | 777 | 66 |
| 9 | OKLAHOMA ENERGY ACQUISITIONS LP | 25,694 | 388 | 66 |
| 10 | CHISHOLM OIL & GAS OPERATING LLC | 5,169 | 87 | 59 |


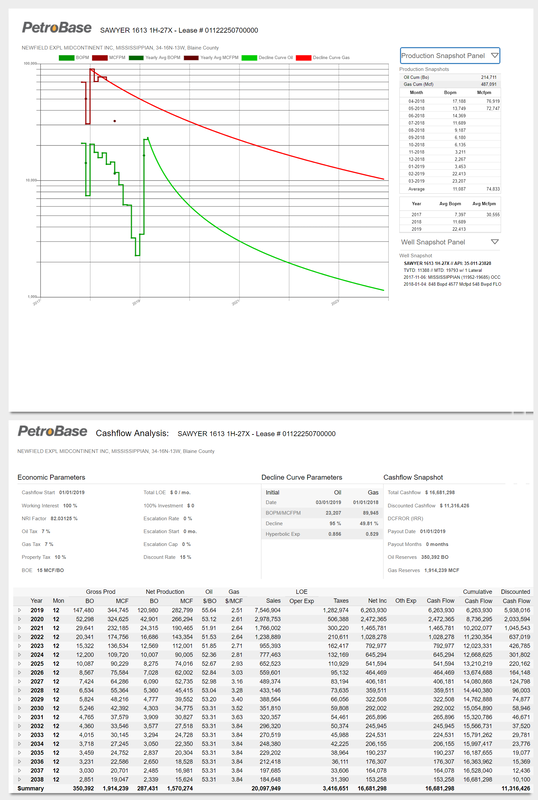
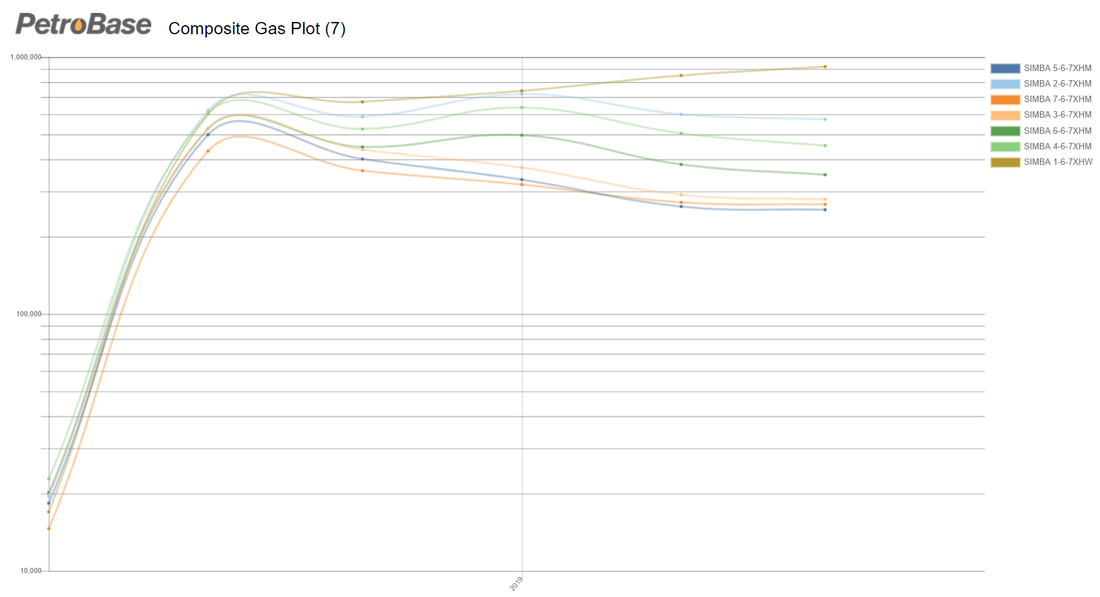
SIMBA Horizontal Woodford Wells
(Composite Gas production plot)
PetroBase will continue to grow and work diligently to remain a reliable source for oilfield software and data solutions.